Classification plots
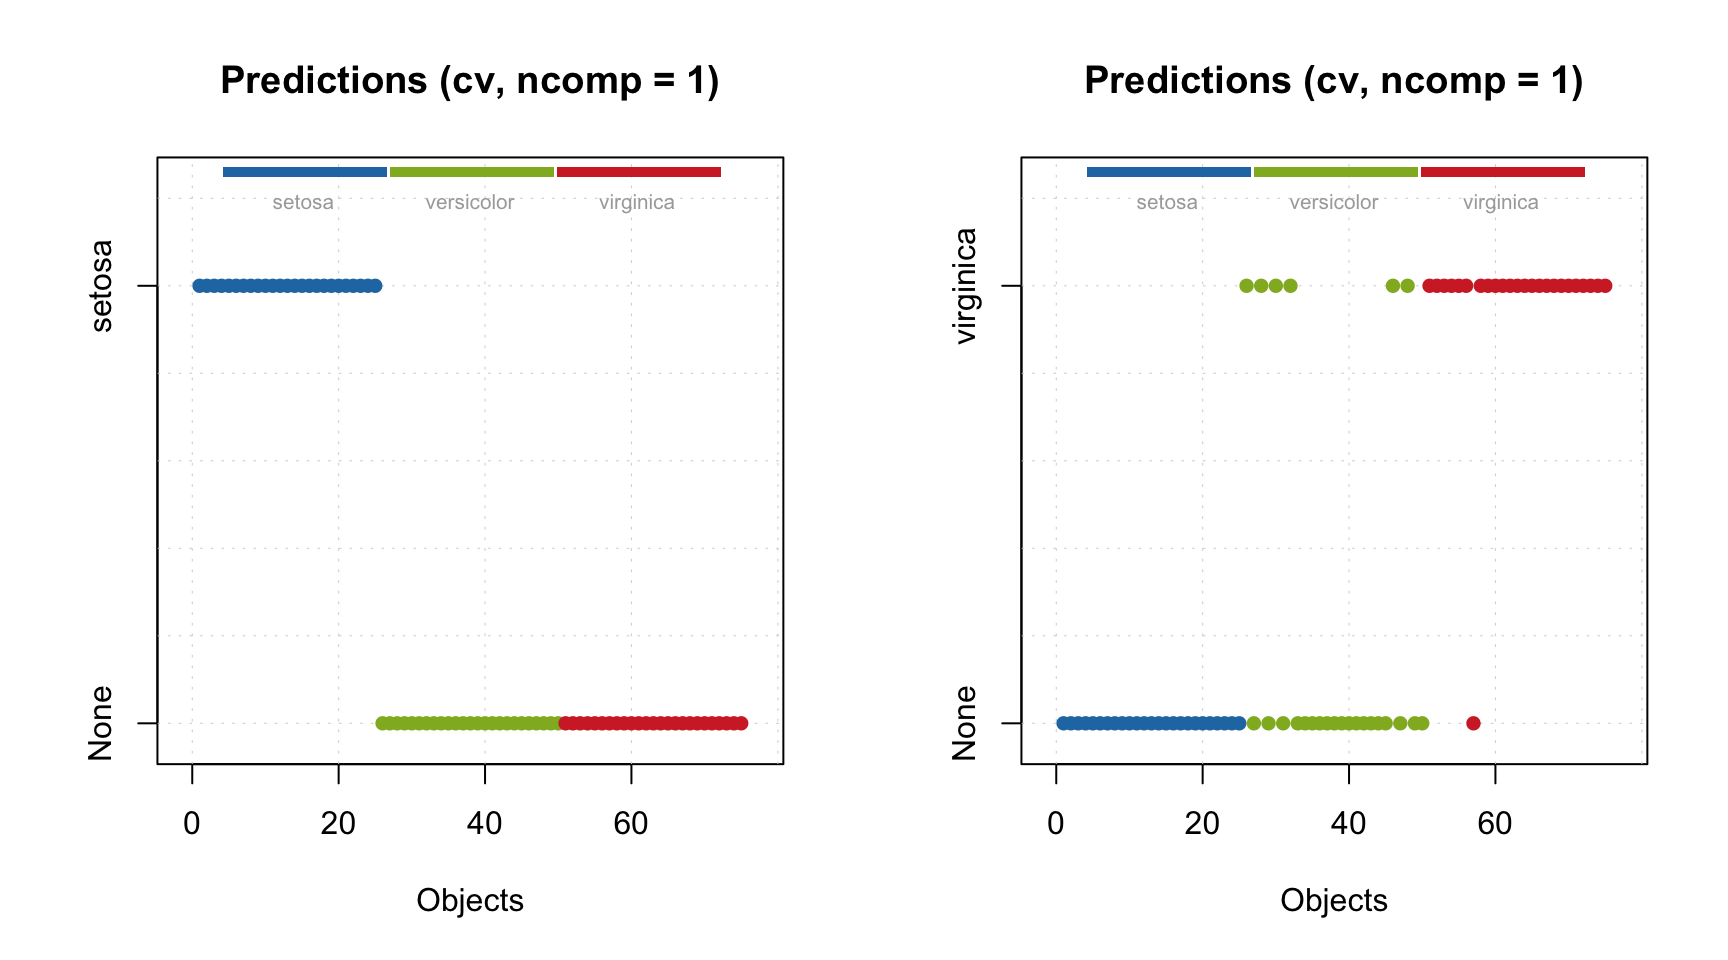
Most of the plots for visualisation of classification results described in the SIMCA chapter can also be used for PLS-DA models and results. Let’s start with classification plots. By default it is shown for cross-validation results (we change position of the legend so it does not hide the points). You can clearly spot for example three false positives and one false negatives in the one-class PLS-DA model for virginica.
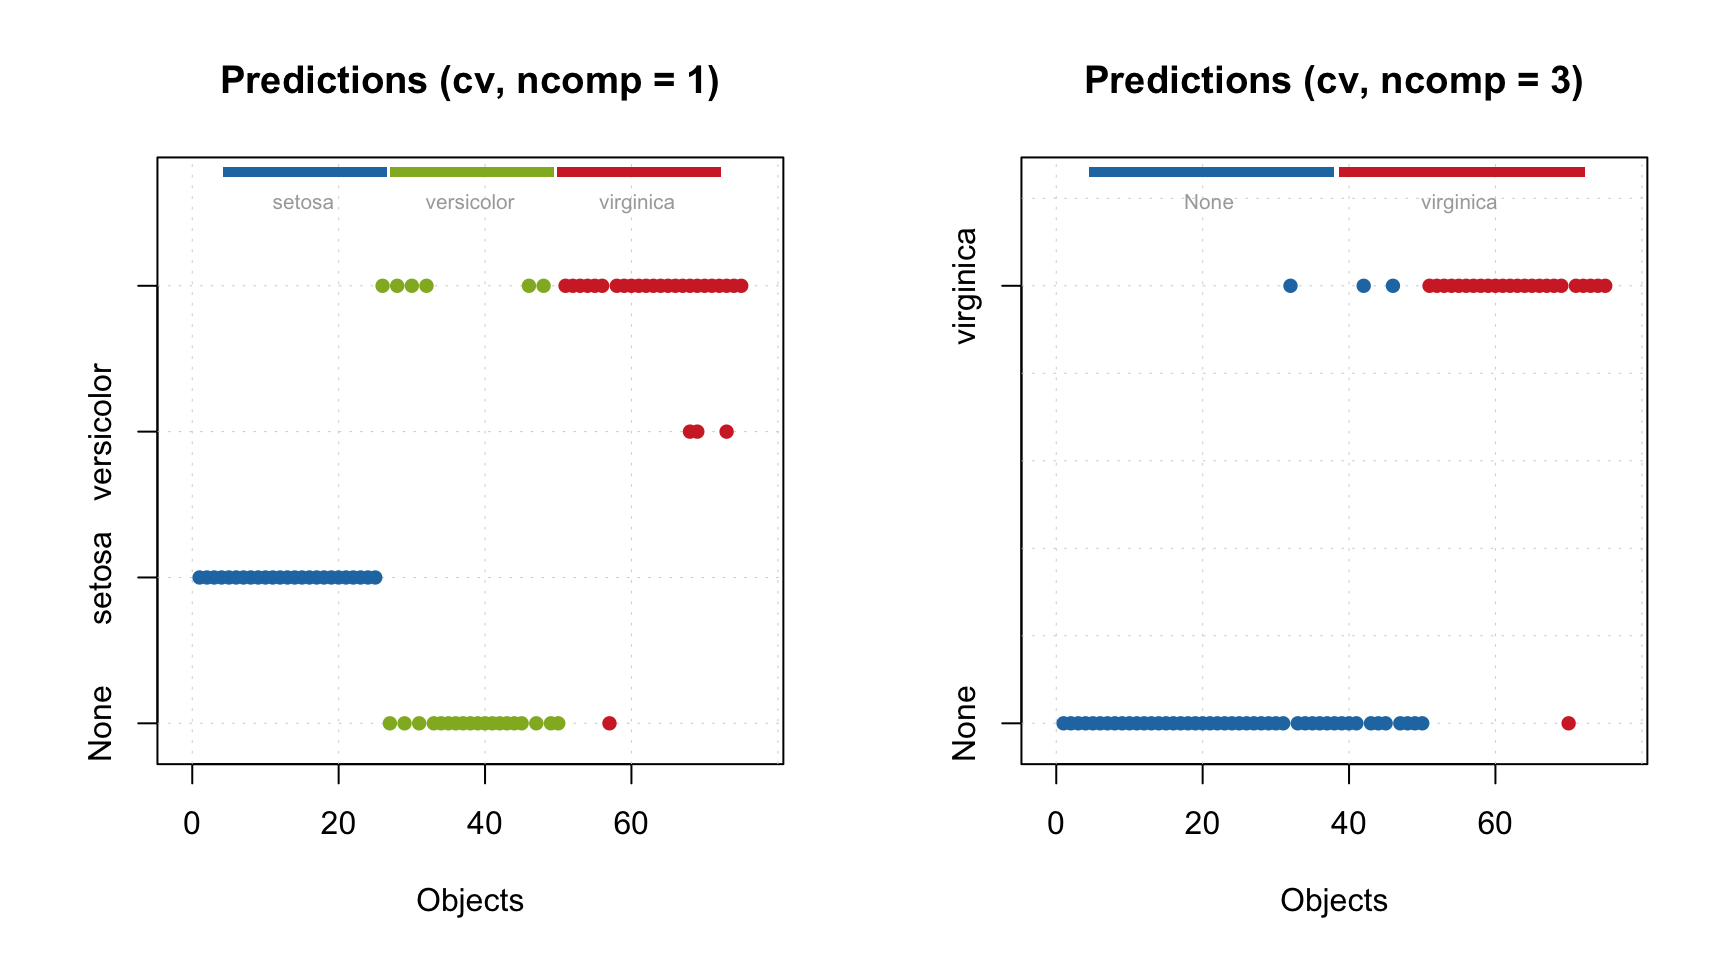
In case of multiple classes model you can select which class to show the predictions for.